

The best metrics to measure brand awareness pair what people tell you with what people do. Recall and recognition surveys show whether your name is known. Branded search, direct traffic, brand mentions, share of voice, social reach and earned media coverage show whether that familiarity turns into behavior. A survey suits you if you can fund primary research. Branded search and direct traffic suit a lean team, because both cost nothing. Share of voice and mentions suit crowded markets, and earned media suits PR-led brands.
The trouble is that awareness lives in people’s heads, so no single dashboard number captures it. Most teams default to followers and page views, then cannot say whether more of the right people know them than last quarter. Each metric below fills a different gap, and each has a trap that makes it look better or worse than reality.
At Purple Word Box, we work on the visibility side of this problem through media relations, content and profile building, so we care about proof that awareness is moving. Below you get seven metrics, the exact way to pull each number, a worked example, and the mistakes that skew the reading. The last section shows how to combine them into one scorecard you can review monthly.
1. Unaided recall and aided recognition surveys
What it tells you
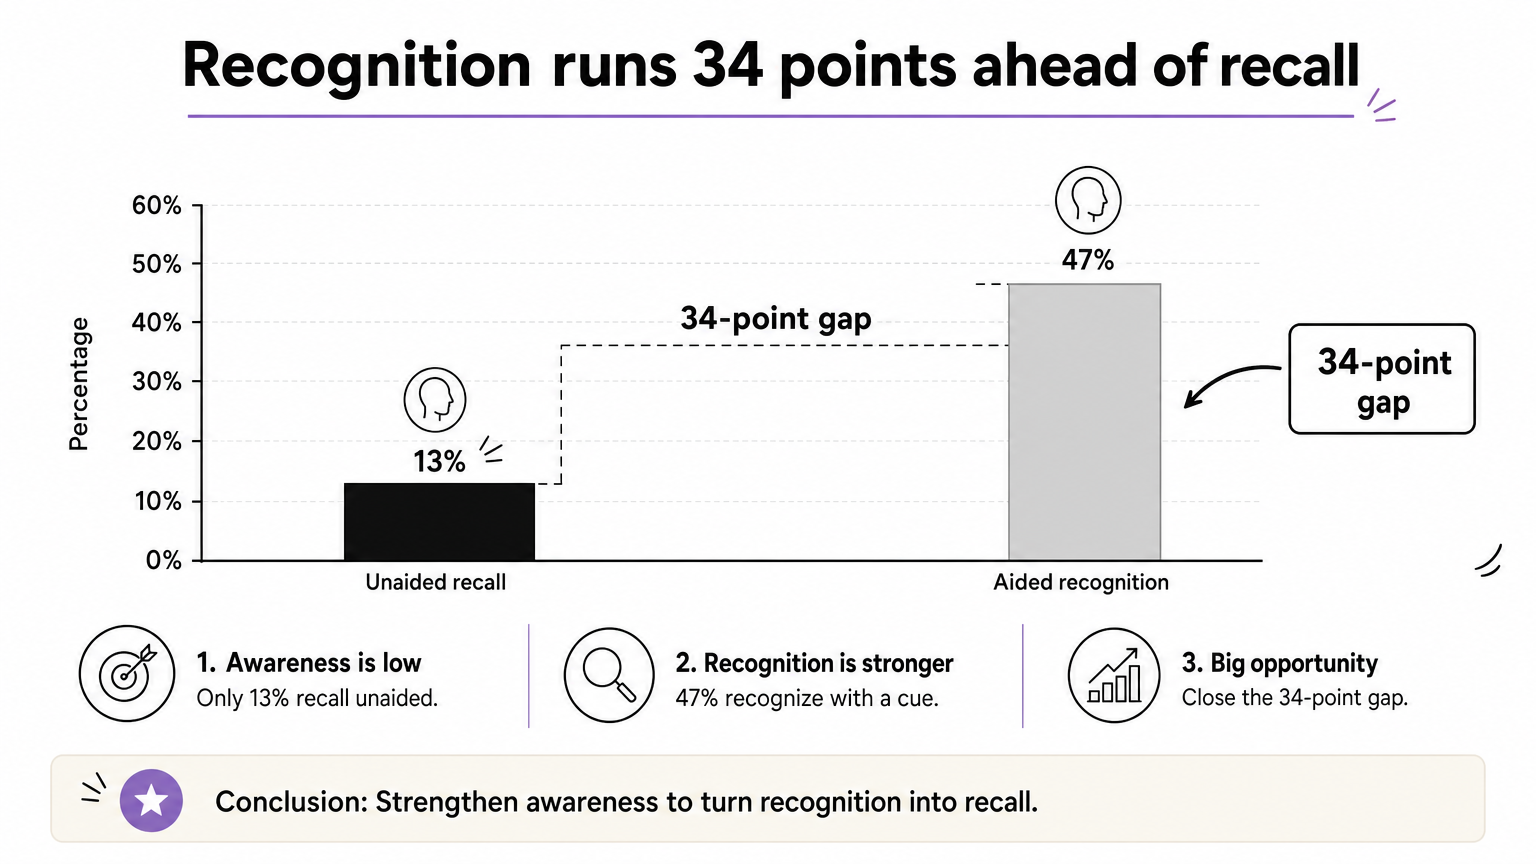
Surveys are the only way to measure brand awareness directly, because they ask the people you want to reach. You get two numbers. Unaided recall is the share of respondents who name your brand when asked about your category with no prompt. Aided recognition is the share who say they know you when shown a list. Recognition is always higher than recall, and the gap between them shows how shallow your familiarity is.
A survey is the only metric that asks people whether they know you, so every other number should be checked against it.
How to track it
Run the same short survey on a fixed schedule and keep the question order identical every time.
- Define the audience by who you want to win, such as finance directors at mid-sized South African companies, not your existing customers.
- Ask the unaided question first: "Which brands come to mind when you think of [category]?"
- Then ask the aided question, showing your brand among eight to ten real competitors.
- Aim for at least 400 respondents per wave. At that size the margin of error is about ±5 points. Narrow B2B audiences will give you smaller samples, so treat those results as directional.
- Repeat the survey quarterly.
Here is a worked example. Of 400 respondents, 52 name your brand unprompted and 188 pick it from the list. Unaided recall is 52 / 400 = 13%, aided recognition is 188 / 400 = 47%, and the gap is 34 points. If recall rises to 16% next quarter while recognition holds, your brand is moving from familiar to top of mind.
Common mistakes
Most survey errors come from sloppy setup, not from the tool you use. Watch for these:
- Sending the survey only to your email list or followers, who already know you and inflate the result.
- Showing the brand list before the unaided question, which contaminates the answer.
- Rewording questions between waves, so you can no longer compare results.
2. Branded search volume
What it tells you

Branded search volume counts how often people type your company name, or a close variation, into a search engine. It is a strong sign of active recall, because the person remembered you without being shown a link. Rising branded searches after a media feature, a talk or a campaign are some of the clearest evidence that awareness is turning into intent.
When people search for you by name, they already know who you are.
How to track it
Use two free tools that answer different questions.
- Open Google Search Console, go to the Performance report and add a Query filter that contains your brand name. Include common misspellings and your main product names.
- Compare clicks and impressions for the last three months against the three months before.
- Use Google Trends to compare your name against two or three competitors. Trends shows a relative index from 0 to 100, not real search counts, so use it for direction only.
- Export the Search Console data monthly, because it keeps about 16 months of history.
For example, if branded impressions grow from 1,200 in one quarter to 1,500 in the next, that is a 25% rise. It means something only if it holds after any campaign ends.
Common mistakes
A branded search spike is easy to misread, so check the cause before you celebrate.
- Counting searches from existing customers looking for a login page, which are navigation, not awareness.
- Ignoring seasonality, such as a December dip or a January surge.
- Crediting organic awareness for a jump that your own paid campaign caused.
3. Direct traffic
What it tells you
Direct traffic is the group of visits where someone types your web address, uses a bookmark or follows a link with no tracking data. For brand awareness, the useful slice is new users arriving directly, since they came to you without a search or a link as a nudge. Growth there suggests that your name travels by memory and word of mouth.
New direct visitors are people who remembered you without any prompt.
How to track it
In Google Analytics 4, open the Traffic acquisition report and look at the Direct channel under the default channel group. Switch the view to new users, then compare month against month. Narrow it further by checking how many direct sessions land on your homepage or a short, memorable URL, since those are most likely typed in by hand.
Fix the biggest data problem before you start. Direct is a catch-all for visits the tool cannot attribute, so tag every email, PDF, QR code and social post with UTM parameters. Once you do, untagged traffic stops hiding inside the Direct bucket and the figure gets cleaner.
Common mistakes
Direct traffic is noisy, and a few habits make it worse.
- Treating all direct visits as awareness when many are returning customers or staff.
- Missing "dark social", such as links shared in private messages, which land in Direct.
- Leaving out bot filtering, so a crawler spike looks like growth.
4. Brand mentions and sentiment
What it tells you
Brand mentions count how often your company, spokespeople or products are discussed online, and sentiment shows whether the tone is positive, neutral or negative. Track direct mentions that use your name and indirect mentions such as misspellings, product names, executive names or a tagline without the brand. Volume tells you how visible you are, and sentiment tells you whether that visibility helps.
Mentions tell you how far your name travels, and sentiment tells you whether that is good news.
How to track it
Start free and add tools only when the volume justifies it.
- Set up Google Alerts for your brand name, common misspellings, your product names and your leaders’ names.
- Add a social listening tool when you need coverage of social platforms, which alerts miss.
- Log each mention weekly in a spreadsheet with the date, source, link, sentiment and rough reach.
- Review the monthly total and the sentiment split.
A simple example: you log 40 mentions in month one and 65 in month three, a rise of 62.5%. If positive and neutral mentions still make up most of the total, awareness is growing without a reputation cost.
Common mistakes
Raw counts can mislead you in a few predictable ways.
- Letting one viral complaint or one big news story distort the trend.
- Tracking a brand name that is also a common word without filtering out irrelevant results.
- Counting volume and ignoring the tone of the conversation.
5. Share of voice
What it tells you
Share of voice shows how much of the category conversation your brand owns compared with competitors. It matters because awareness is relative: a rising mention count means little if rivals are growing faster. Share of voice is also the metric that tells you whether you are gaining or losing ground in your market.
Your numbers can grow while your position shrinks, and only share of voice shows you that.
How to track it
The formula is simple: share of voice = your metric / total market metric, where the total includes you. Pick one source and use it consistently, such as media mentions, social mentions or search impressions.
- Choose three to five direct competitors and keep that list fixed.
- Count each brand’s mentions over the same period and in the same source.
- Add the counts, then divide yours by the total.
As an example, you have 450 mentions and competitors have 900, 700 and 450. The total is 2,500, so your share of voice is 450 / 2,500 = 18%. Review it quarterly, because monthly swings are mostly noise.
Common mistakes
Share of voice is only as good as the comparison behind it.
- Mixing sources, such as your social mentions against a rival’s press coverage.
- Changing the competitor set between periods, which breaks the trend.
- Using a competitor list so narrow that you look like the leader by default.
6. Social reach and engagement
What it tells you
Social reach counts the unique people who saw your content, and engagement shows whether they did anything about it. For awareness, reach matters more than followers, because reach shows how many people outside your existing audience your content found. Engagement rate adds a quality check by showing whether those people cared enough to react, comment or share.
Followers show who chose you once, and reach shows who keeps seeing you.
How to track it
Native analytics on each platform are enough. LinkedIn page analytics usually carry the most weight for B2B brands. Record these monthly for each channel:
- Reach or impressions per post and in total.
- Follower growth, as a trend and not as a headline.
- Engagement rate, calculated as engagements / impressions.
- Non-follower reach, where the platform splits it out, as Instagram does.
For example, a post that gets 60 reactions, comments and shares on 2,400 impressions has an engagement rate of 60 / 2,400 = 2.5%. Compare that figure against your own past posts, not against another platform.
Common mistakes
Social numbers flatter easily, so keep a skeptical eye on them.
- Celebrating follower counts, especially after a giveaway or any bought growth.
- Comparing platforms directly, when each defines reach and impressions differently.
- Reading a single viral post as a trend.
7. Earned media coverage and backlinks
What it tells you

Earned media coverage measures unpaid mentions of your brand in news, trade and industry publications, podcasts and reviews. Backlinks count the websites that link to you as a result. Together they show whether third parties are introducing you to new audiences, and that borrowed credibility makes every other metric on this list easier to move. Coverage of the kind we helped TreasuryONE gain in mainstream media is exactly what this metric captures.
One placement in a respected outlet can do more for awareness than a hundred posts on your own channels.
How to track it
Keep a coverage log and review it monthly.
- Record each placement with the date, outlet, link, and whether your key message appeared.
- Group outlets into tiers, such as national, trade and niche, and count placements by tier.
- Check the Links report in Search Console for external sites linking to you, and watch the number of linking domains.
- Use referral traffic in Google Analytics 4 to see which placements actually send readers.
A month with three trade placements and one national feature beats a month with eight minor mentions. Weight by outlet and message, not by raw count.
Common mistakes
Coverage counts are easy to inflate, so treat them with care.
- Counting syndicated copies of one story as separate placements.
- Treating every outlet as equal, when reach and credibility differ widely.
- Looking only at volume and never checking whether your message came through.
How to combine these metrics into one scorecard
Pick a core set
You do not need all seven metrics. Pick four or five that match your situation, and make sure at least one is a survey and at least one is behavioral. A small business can run a short survey, branded search, direct traffic and mentions. A brand in a crowded market should add share of voice. A PR-led brand should add earned media, and a social-heavy brand should add reach.
Set a baseline and a cadence
Take a baseline in the first month, then review on a fixed rhythm. The table below gives a starting setup.
| Metric | Where to get it | How often | What to record |
|---|---|---|---|
| Recall and recognition | Survey tool | Quarterly | % unaided, % aided |
| Branded search | Search Console, Google Trends | Monthly | Branded impressions and clicks |
| Direct traffic | Google Analytics 4 | Monthly | New users via Direct |
| Brand mentions | Google Alerts, listening tool | Weekly log, monthly review | Count and sentiment split |
| Share of voice | Same source as mentions | Quarterly | % of category total |
| Social reach | Native platform analytics | Monthly | Non-follower reach, engagement rate |
| Earned media | Coverage log, Search Console | Monthly | Placements by tier, linking domains |
Judge awareness on at least two quarters of consistent data, never on a single month.
Read the metrics together
The value of a scorecard is in the patterns. If survey recall rises and branded search follows, your awareness work is landing. If branded search jumps but recall stays flat, a short campaign spike probably drove it and may fade.
Mentions rising while sentiment falls is a warning, not a win. Reach growing while direct traffic stays flat suggests people see your content but do not remember you. Write a one-line note on each pattern in your monthly review, so you act on it instead of just reporting it.
Start with a baseline, then keep score
Measuring awareness works when you combine a survey that asks people directly with behavioral signals that show what they do. Branded search, direct traffic, mentions, share of voice, social reach and earned coverage each add a different angle, and your job is to track a few of them consistently. Set the baseline now, keep the method the same, and compare quarter to quarter.
If your numbers are flat and you want more coverage, credibility and visibility to move them, talk to Purple Word Box about media relations and PR.